It can be a while before the DNA test results arrive – it takes time for the lab to process your sample, so once the company has received your test it’ll take anything from 4-6 weeks for MyHeritageDNA and Vitagene or up to 10-12 weeks with LivingDNA. Sometimes, the lab can be behind on processing, so you’ll have to wait even longer.
This only makes it even more exciting when you finally get that email notifying you that your results are available.
How to Interpret Different Sections of Your DNA Results
Ethnicity Estimate
It's easy to be overcome by the amount of information in your DNA test reports, but by taking it slowly, you can make sense of it all. Although every DNA report is slightly different, they do share many of the same characteristics, so this guide to interpreting your report will be useful no matter which test you used.
One of the first areas you’ll look at is the ethnicity estimate. It’s important to remember that this is only an estimate, which shows the likelihood that your ancestors originated from a particular area. To come up with these results, the company compares your sample against samples from people with deep-rooted DNA from that region. Your ethnicity will be shown as a list of percentages for each region.
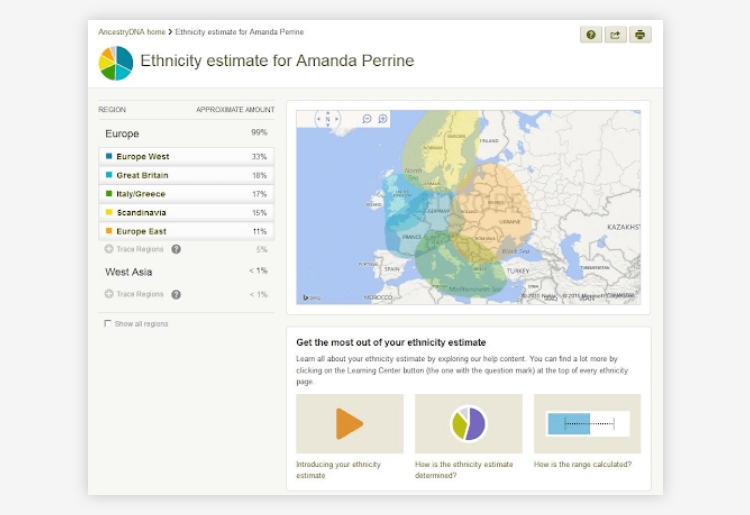
Alongside the list of percentages, you'll find an interactive map. The map is divided into various regions (the exact number and divisions depend on the test you use), and those regions are color-coded according to your DNA match with that area. You can zoom in and out to view your connections with that region in more detail and click on a region to learn more about the characteristics of its typical population.
You might find that your ethnicity estimate includes Trace Regions or Low Confidence Regions. Trace Regions are geographical locations where your genetic link is below 15%. This could mean that a technological error linked you with this area and you don’t actually have any genetic heritage from there, or it could be a significant part of your ancestry. A Low Confidence Region means that your link is even more tenuous – it’s 6% or less. If you see Trace or Low Confidence regions on your report, you should correlate them with your own research to see if they are likely to be correct. As technology improves with time, your connection with these areas could be proved more certainly, or totally disproved.
LivingDNA offers a choice of 3 views for your ethnicity estimate, displayed on an interactive color-coded map. You can choose the Cautious view, which shows only those population groups which they are confident includes at least one of your ancestors. The Standard view shows both the most likely population groups for your genetic heritage along with the percentage of ‘unassigned’ genetic material, which they cannot confidently attribute to a specific group. Finally, the Complete view assigns a region for every element of your DNA, even those which are uncertain, allowing you to take a guess at new avenues of genealogy research.
Possible Matches
The second important section of your DNA report contains your possible matches. Different companies organize these in a slightly different manner, but in every case, your level of relationship is measured in centimorgans (cM). This refers to how many sections of your DNA are shared with your possible match. Your report will list the number of shared cM and a percentage that shows how confident they are that you are related. Up to the level of 3rd cousinhood, you can be pretty certain that there is a relationship there somewhere, even if you have to work hard to find it. By showing the confidence percentage, you can focus on those matches that are most likely to be productive.
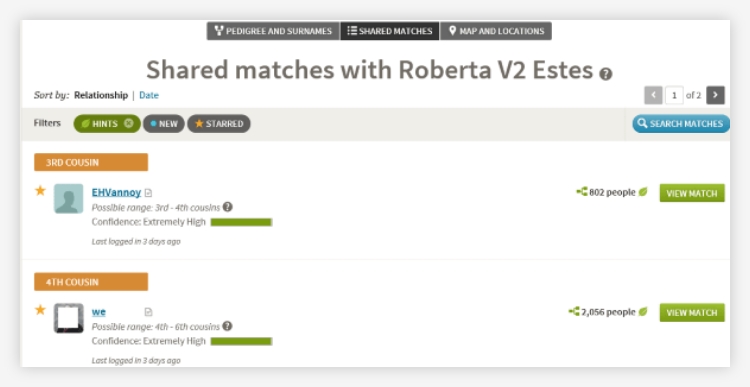
Your possible matches can be the biggest boost to your genealogy research. You might already know most of them, but the ones that you don’t know could be important for filling in your family tree. It’s well worth making contact with your matches to see if they have found information that can help complete your family tree. MyHeritage lets you compare your shared ethnicities, which can be very useful if you discover that both of you share a trace ethnicity, for example.
More Areas
If you’re looking at your DNA test results on the MyHeritage site and you’re interested in the scientific side of genetics, you’ll be able to use their chromosome browser. This can be too technical for some users, but others will love it. The chromosome browser allows you to compare your DNA with that of a match to see which segments overlap and to get a deeper insight into your genetic makeup.
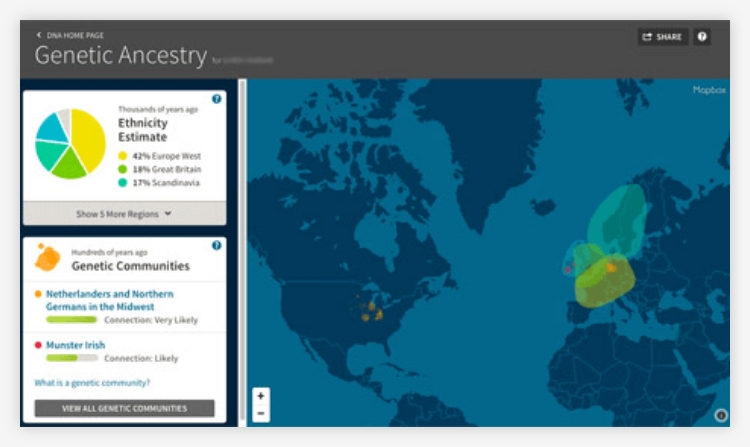
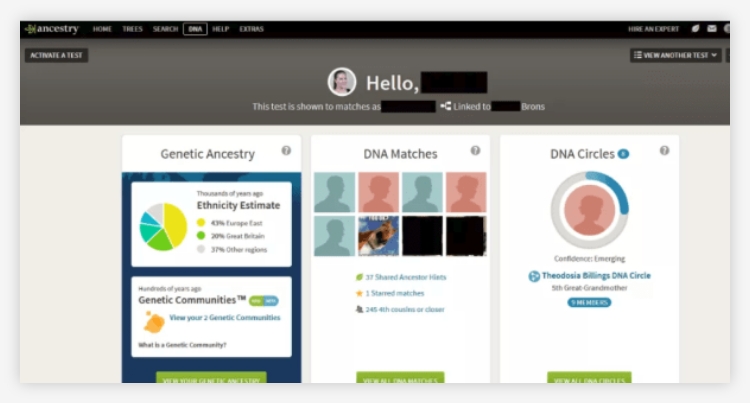
Ancestry test reports include a cool feature called Genetic Communities. You could belong to one or more genetic community, or none, according to your DNA profile. By exploring your genetic community, you can learn more about your ancestors' common experience, the region to which you're connected, and typical immigration patterns over the years. You can also browse other DNA matches in the same genetic community and see common family names, which could help you in your research.
Ancestry’s reports also show a map with areas of your heritage and areas that are connected to any shared matches. Birth locations show up as different colored pins, and you can move around the map and zoom in to learn more about each region. You’ll find this under Map and Locations.
Some DNA reports include information about your genetic health and inherited physical traits. For example, Vitagene and 23andMe both offer deep insights into your carrier status for genetic diseases, propensity to conditions such as heart disease, and even chances of being lactose intolerance. Vitagene gives you a detailed breakdown of your natural capabilities for traits like metabolizing alcohol or losing weight, too.
Sample Reports
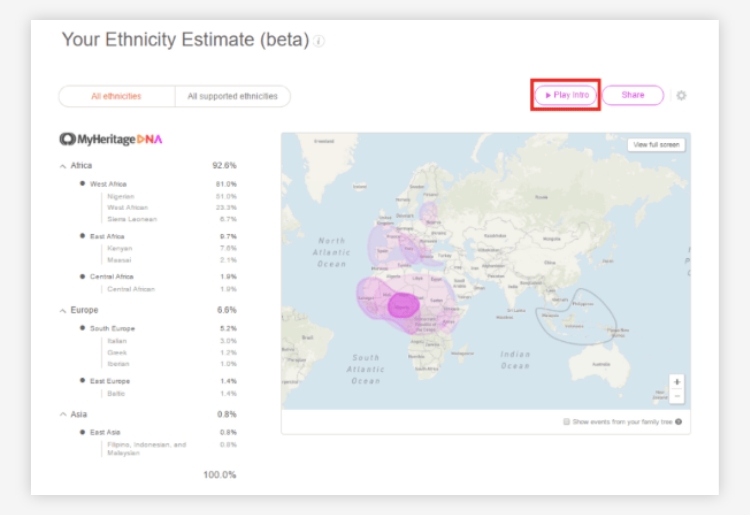
MyHeritage reports begin with a summary page that gives an overview of your ethnicity and the number of DNA matches. From here, you can click to explore your ethnicity breakdown or read the list of possible DNA matches.
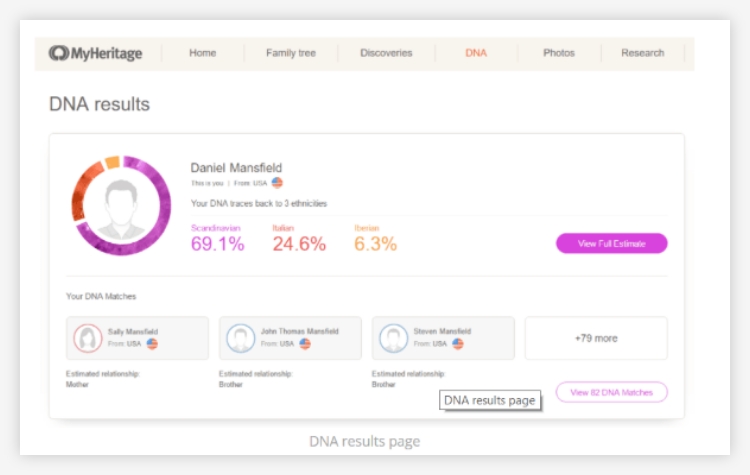
Your ethnicity estimate is shown as a color-coded map and as a list of percentages. You can choose to watch a guided, animated intro to your heritage by clicking ‘Play Intro’ or just explore it on your own by zooming in for a more detailed breakdown.
MyHeritage displays DNA matches as a list in descending order of closeness. So, the highest matches are at the top by default, although you can click on the tabs to rearrange the order. When you click on a match, the ‘Review DNA’ button gives you more information about that person and the ‘View Tree’ button shows you their family tree, if they have one on the site.
Ancestry’s DNA reports are fairly similar. You’ll first be shown an overview page, which gives a summary of your ethnicity estimate and DNA matches as well as DNA circles if you are part of any.
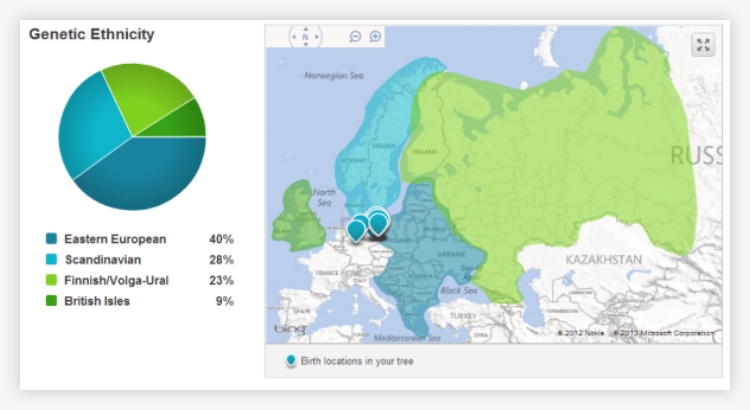
From here, you can click to see your ethnicity estimate, which is shown as an interactive color-coded map, like MyHeritage, and a list of percentages. When you click on a region, you can zoom in and see a more specific geographic location for your ancestors and learn more about that region.
Ancestry groups your DNA matches into expected family relationships. So, if your children have taken the DNA test, they’ll be shown together. You can click on a DNA match to learn more about their ethnicity and your shared DNA and a way to get in contact with them. Ancestry also compares your saved family tree with your match’s tree, if you both have one, and indicates your common ancestor.
Ancestry’s DNA reports include a few more interesting fields, so take the time to explore them.
Here's How to See Your Report
- Log in to the MyHeritageDNA site
- Click on the DNA tab to access the "DNA Hub
- To see the full Ethnicity Estimate report click "View Full Estimate". To see all DNA matches, click "View XX DNA Matches"
- Log in to the AncestryDNA sit
- Click "DNA" tab at the top of the page
- In the drop-down menu, click "Your DNA Results Summary
- Assuming your DNA results are ready, you can either select "Discover Your DNA Story" to view your ethnicity estimate, "View All DNA Matches" to see all of your DNA matches, or "View All DNA Circles" to see all ancestors in your Ancestry family tree
What to Do if Your DNA Reports Aren’t What You Expect
It’s quite common for people to get DNA results that aren’t what they expected. Very often this happens when your results aren’t the same as your siblings or other close family members who were tested. Before you start wondering if you were secretly adopted, there’s a much simpler explanation. Although both you, and your brother or sister, have 50% of each parent’s genetic makeup, there’s no reason why you’d have inherited the same 50% from each parent. In fact, it’s more likely that you didn’t. So, one sister could have a genetic heritage from colonial New England and Eastern Europe, while the other sister’s DNA test doesn’t show any connection to New England because she didn’t inherit those genes.
It's also possible that your DNA test shows ethnicity from further back in your family tree then you've reached in your research. For example, your family tree for the last 4 generations could derive entirely from Western Europe, but your great-great-grandmother traveled from North Africa to France as a baby.
It’s also important to remember that every DNA testing company divides the world up into different ethnic regions. For example, Ancestry’s tests use 150 regions while MyHeritage divides the world up into 42, and 23andMe has just 31 regions. These regions overlap, and some countries and areas can move between regions according to different tests. That means that if your ancestry is from somewhere in central Africa, you could be placed in very different regions depending on which test you use. LivingDNA divides the British Isles into 21 regions, so you can pinpoint your family's place of origin with much greater accuracy than if you used a test with fewer divisions.
If you've received varied results after using different DNA tests, it's worth bearing in mind that each testing company uses different algorithms and sample populations in processing your DNA sample. That doesn't mean that any one test is wrong, just that it has highlighted a different aspect of your heritage.
How to Get More From DNA Tests
If you use DNA tests correctly, they can be a powerful tool for your family history research. When using a site that has one of the best family tree softwares, such as Ancestry or MyHeritage, you should always link your results. This way you can correlate your DNA report with your own research and locate better family matches.
You should also take a DNA test with more than one company, to see how the results differ and what new information a different testing algorithm brings up. The more of your family members get tested, the more data you’ll have to work with, especially for trace ethnicities and low confidence regions. This is because some family members could have inherited a larger share of some trace genetic heritage than others.
For the same reason, you should follow up possible DNA matches suggested by the test report. Your more distant cousins can share their research with you while comparing their DNA reports can shed light on which ancestor is the source for some trace ethnicities.
Sarah Pritzker is an accomplished content writer for top10.com. With years of experience, Sarah specializes in the dynamic field of online consumer products, leveraging meticulous research to provide insights into various options on the market. Her expertise is evident in her ability to demystify complex subjects and guide readers in choosing the best solutions tailored to their needs.


