
Pulling statistics from numerous sources has determined the 5 states with the happiest workers and the 5 states with the unhappiest workers. While Hawaii, Utah, Minnesota, and Massachusetts came out on top, it seems that Louisiana, West Virginia, Mississippi, New Mexico, and Oklahoma have a lot to work on!
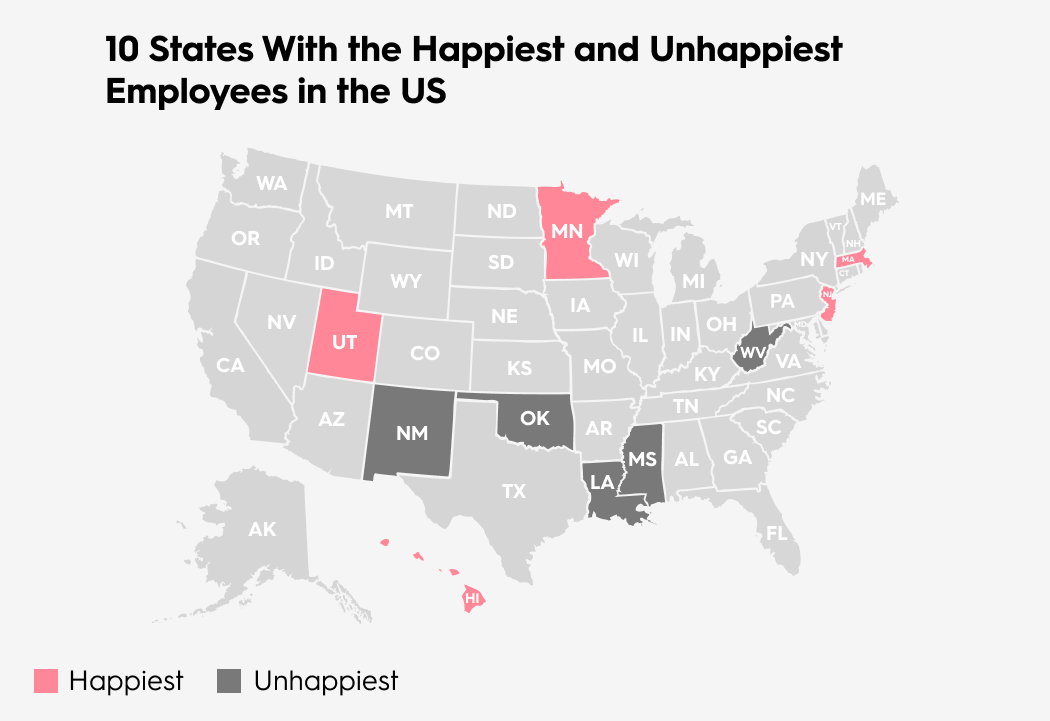
Top 5:
Hawaii
Utah
Minnesota
Massachusetts
New Jersey
Bottom 5:
(#1 = the most unhappy)
Louisiana
West Virginia
Mississippi
New Mexico
Oklahoma
Each state was evaluated with the following data points and given a score from 1 to 5. Then each statistic score was weighted and totaled to arrive at a final score. Here’s a closer look at how each state ranks, and why:
Top 5 States with the Happiest Employees:
1. Hawaii - Final Score: 4.65
- Happiest Points: 5
- Wage Points: 3
- Domestic Violence Points: 5
- Employment Points: 5
- Minimum Wage Points: 4
- Alcohol Consumption Points: 4
- Candy Points: 5
- Workplace Injury Fatalities Points: 5
- Listed on Healthiest States Top 10: Yes
- Listed on Friendliest States Top 10: Yes
2. Utah - Final Score: 4.31
- Happiest Points: 5
- Wage Points: 4
- Domestic Violence Points: 5
- Employment Points: 5
- Minimum Wage Points: 2
- Alcohol Consumption Points: 5
- Candy Points: 2
- Workplace Injury Fatalities Points: 5
- Listed on Healthiest States Top 10: Yes
- Listed on Friendliest States Top 10: No
3. Minnesota - Final Score: 4.30
- Happiest Points: 5
- Wage Points: 4
- Domestic Violence Points: 5
- Employment Points: 5
- Minimum Wage Points: 2
- Alcohol Consumption Points: 5
- Candy Points: 2
- Workplace Injury Fatalities Points: 5
- Listed on Healthiest States Top 10: Yes
- Listed on Friendliest States Top 10: Yes
4. Massachusetts - Final Score: 4.15
- Happiest Points: 4
- Wage Points: 4
- Domestic Violence Points: 5
- Employment Points: 5
- Minimum Wage Points: 5
- Alcohol Consumption Points: 4
- Candy Points: 1
- Workplace Injury Fatalities Points: 5
- Listed on Healthiest States Top 10: Yes
- Listed on Friendliest States Top 10: No
5. New Jersey - Final Score: 4.05
- Happiest Points: 4
- Wage Points: 5
- Domestic Violence Points: 5
- Employment Points: 4
- Minimum Wage Points: 3
- Alcohol Consumption Points: 4
- Candy Points: 1
- Workplace Injury Fatalities Points: 5
- Listed on Healthiest States Top 10: Yes
- Listed on Friendliest States Top 10: No
Top 5 States with the Unhappiest Employees:
(#1 = the most unhappy)
1. Louisiana - Final Score: 1.85
- Happiest Points: 1
- Wage Points: 1
- Domestic Violence Points: 4
- Employment Points: 2
- Minimum Wage Points: 2
- Alcohol Consumption Points: 4
- Candy Points: 1
- Workplace Injury Fatalities Points: 5
- Listed on Healthiest States Top 10: No
- Listed on Friendliest States Top 10: No
2. West Virginia - Final Score: 1.90
- Happiest Points: 1
- Wage Points: 1
- Domestic Violence Points: 3
- Employment Points: 2
- Minimum Wage Points: 3
- Alcohol Consumption Points: 5
- Candy Points: 1
- Workplace Injury Fatalities Points: 5
- Listed on Healthiest States Top 10: No
- Listed on Friendliest States Top 10: No
3. Mississippi - Final Score: 2.05
- Happiest Points: 2
- Wage Points: 1
- Domestic Violence Points: 4
- Employment Points: 1
- Minimum Wage Points: 2
- Alcohol Consumption Points: 4
- Candy Points: 1
- Workplace Injury Fatalities Points: 5
- Listed on Healthiest States Top 10: No
- Listed on Friendliest States Top 10: No
4. New Mexico - Final Score: 2.10
- Happiest Points: 2
- Wage Points: 1
- Domestic Violence Points: 4
- Employment Points: 2
- Minimum Wage Points: 2
- Alcohol Consumption Points: 4
- Candy Points: 1
- Workplace Injury Fatalities Points: 5
- Listed on Healthiest States Top 10: No
- Listed on Friendliest States Top 10: No
5. Oklahoma - Final Score: 2.2
- Happiest Points: 1
- Wage Points: 2
- Domestic Violence Points: 2
- Employment Points: 4
- Minimum Wage Points: 2
- Alcohol Consumption Points: 5
- Candy Points: 1
- Workplace Injury Fatalities Points: 5
- Listed on Healthiest States Top 10: No
- Listed on Friendliest States Top 10: Yes
Unless otherwise noted, all data were sourced from WorldPopulationReview.com. Here’s a breakdown of how we arrived at our final scores:
The Happiest States Equaled 30% of the Total Score
The happier the state, the higher the points.
This statistic was given the most influence over the final score because it took into account people’s emotional and physical well-being, work environment, community, and environment divided into 31 different metrics. This happiness statistic does take into account a lot, but it didn’t give a well-rounded view, so more data points were added.
Average Wage as % of Living Wage Equaled 20% of the Total Score
The higher the percentage, the higher the points.
Having a great job and being happy working there depends a lot on how much you are getting paid and if you can support yourself and your family. For this statistic, the average household income for full-time workers in each state was divided by its living wage. This was done to ensure wage comparisons across states accounted for variations in the cost of living.
Domestic Violence Average Equaled 10% of the Total Score*
The lower the percentage, the higher the points.
This statistic was taken into account because data shows that many abusers do not feel control or satisfaction in their professional lives. They then take it out on their family at home physically or because of job loss pressure. This statistic was weighed at only 10% since not all domestic violence situations result from job dissatisfaction/unemployment.
*If you or someone you know is a victim of domestic violence, several resources are available to help. Call the National Domestic Violence Hotline at 1-800-799-SAFE (7233).
Employment Rate Equaled 10% of the Total Score
The higher the employment rate, the higher the points.
This statistic was taken into account because each state has a very different unemployment rate. This affects each state’s economy and, in turn, each state’s employee’s happiness.
The Minimum Wage Equaled 10% of the Total Score
The higher the minimum wage, the higher the points.
This statistic goes along with the average wage. The higher the minimum wage was, the closer the lowest paid employees are to a livable wage.
Alcohol Consumption Per Person Equaled 5% of the Total Score
The lower the consumption, the higher the points.
While unique to happiness surveys, this statistic was used because people gravitate more to alcohol when unhappy/unsatisfied with their job/career. It was weighted lower to take out any alcohol consumption related to addiction.
Candy Stores per 100,000 People Equaled 10% of the Total Score
The higher the number of stores, the higher the points.
While unusual, this statistic is used because so many people treat themselves to something special, mostly something sweet, when they want to celebrate something at work. From candy to chocolate to cake. Data was taken from USAToday.com.
Workplace Injury Fatalities Equaled 5% of the Total Score
The lower the fatalities, the higher the points.
This statistic was weighted low but included because morale dips when there are casualties at employment places: the more fatalities, the lower the employee happiness. Data was taken from the Bureau of Labor Statistics.
If a state was listed on either of the Top 10 lists, their weighted score increased by 0.1. If they were listed on both lists, then the state’s score was increased by 0.2.
- Healthiest States Top 10 (Yes if listed, No if not listed)
- Friendliest States Top 10 (Yes if listed, No if not listed)
Happiness Comes From Both External and Internal Factors
While happiness can’t be definitively measured, it comes from both external and internal factors. These different factors were looked at and measured to find the states with the happiest and unhappiest employees. The top 5 states are obviously doing something right to keep those who work in their state as happy as possible, but there is a lot of work that still needs to be done in the bottom 5.
Was your state on either list? If not, where do you think your state would fall?
You may also like:
The Best Business Payroll Services - Simplify Employee Payments
Top 10 Companies With Crazy Employee Perks You Won’t Believe
Jessica Strull writes for Top10.com. She is passionate about bringing awareness to the working female perspective and empowering people with knowledge about personal finances. Beyond her work for Top10.com, Jessica's writing has been featured on SheOwnsIt.com, WomenWhoMoney.com, and NewsBreak.com. Jessica holds a bachelor’s degree in Human Resource Management. When she’s not writing, you can find her binging bad movies, reading great books, or hanging out at Walt Disney World.


